View Debug Information for Your Wired Properties Spring'23 release
Access debug information for wired properties and methods on a component via custom formatters in Chrome DevTools.
Where: This change applies to custom Lightning web components in Lightning Experience, Experience Builder sites, and all versions of the Salesforce mobile app. This change also applies to Lightning web components in Open Source.
Why: Previously, to debug data received with a wired property, you had to use a wired function to return your data and inspect the deconstructed data and error properties.
How: Consider a wired property that looks like this.

To start debugging your wire adapter:
- Enable debug mode in your org.
- Open Chrome DevTools, and then enable custom formatters.
- Find your code in the Sources panel.
Next, inspect your component using this or inspect the rendered custom element. To inspect the rendered custom element, click the <c-apex-wire-method-to-property> element in the Elements panel of Chrome DevTools.
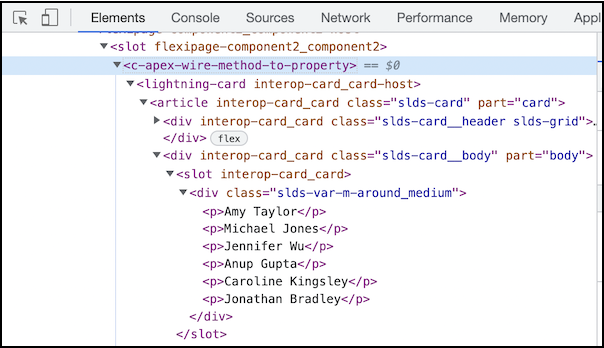
After you click the element, open the Console panel and enter $0 to return the debug information..
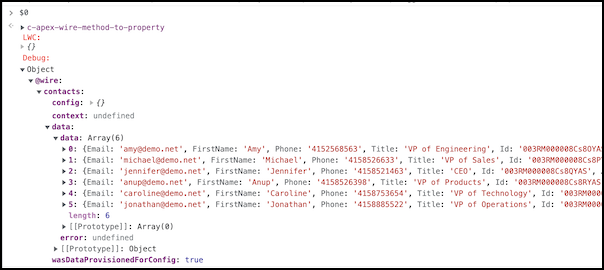
Each wired property or method returns information with the following shape:
data—The last value returned by the wire adapter.config—The last configuration object reported to the wire adapter.context—Only for context wire adapters.isDataProvisionedForConfig—A boolean that specifies whether the data provisioned by the wire adapter corresponds to the config. Returnstrueif the adapter emits data after a config was reported.

Comments
Post a Comment